Chandelier Exit is a volatility based indicator created to enable a trader to stay in a trade until there is a definite trend reversal. As explained below, a trader will be able to avoid early exit and realize maximum returns by using the Chandelier Exit indicator.
Principle and components of Chandelier Exit indicator
The indicator was created by Chuck Le Beau who is a globally acknowledged expert in exit strategies. However, the indicator and the trading system associated with it were introduced to traders and investors by Alexander Elder in his book Come Into My Trading Room published in 2002. The indicator derives its name from the resemblance to a chandelier, which hangs from the ceiling of a room.
The Chandelier Exit is based on the principle that there exists a high probability of a trend reversal whenever the price of an asset moves against the prevailing trend by a distance equal to three times the average volatility.
The indicator is created using the ATR values over a given time period. Other than the ATR, the highest high and the lowest low price of an asset over a specific time period is used in the calculation. While using the daily time frame for analysis, it is advisable to use an input period of 22. The reason is that the Forex (or equity) market remains open for 22 trading days in a month. To ensure a smoothing effect and filter short-term fluctuations or noise, the 22-day price levels is suggested for the calculation. For other timeframes, the trader should determine the suitable input period based on a trial and error approach. There are no hard and fast rules for this.
The primary objective of Chandelier Exit, as mentioned earlier, is to provide an alert about an impending trend reversal at the right time. Thus, Chandelier Exit value is calculated in a different manner for a long and short position.
In an uptrend, the Chandelier Exit values are calculated using the formula:
Long Exit = Highest High in a time period X – 3 × ATR with a period Y.
The multiplier value 3 is referred to as the Chandelier Exit multiplier and can be altered by the trader.
Most traders use the same time period for the variables X and Y, although nothing forbids a trader from using different values.
When a trader uses the same value, say 9, it means that the highest high for 9 hours (H1 timeframe) and the Average Trading Range for 9 hours are used in the calculation of the Chandelier Exit. The uniform input results in a more dependable output.
In case of a downtrend, the Chandelier Exit values are calculated using the formula,
Short Exit = Lowest Low in a time period X + 3 × ATR with a period Y.
The calculated values (intraday, daily, weekly, or monthly) are plotted as a line in the price chart. From the above formula, it can be inferred that the Chandelier Exit line will be above the price in case of a downtrend. On the other hand, the Chandelier Exit line will be below the price in case of an uptrend.
The Chandelier Exit’s multiplier can be changed after taking the implied volatility of the asset into consideration. If the time period is too small, then it may create whipsaws. On the other hand, longer time periods will delay the exits thereby diluting the purpose of the indicator. A larger multiplier is required while trading a currency pair with a higher implied volatility (the quantum of rise or fall in the price of an asset as expected by the market). In equities, it is not uncommon to see a trader using a smaller multiplier during a downtrend as the rate of price decline is usually faster. It is not the case in foreign exchange market, though, where the currencies are traded one against the other.
Using the indicator in Forex trading
The manner in which a Chandelier Exit can be used to trade in the FX market is given below.
Long position
- Wait for a candle to close above the Chandelier Exit.
- When the next candle opens, enter a long position in the currency pair.
- After taking the volatility of the currency pair into consideration, place the stop-loss order a few pips below the Chandelier Exit.
- Keep shifting the stop-loss up as the price makes new highs.
- When the trend reverses, there will be a forced exit from the market.
Short position
- Wait for a candle to close below the Chandelier Exit.
- When the next candle opens, take a short position in the currency pair.
- With due consideration to the volatility of the asset, place a stop-loss order a few pips above the Chandelier Exit.
- Keep shifting the stop-loss down as the price makes new lows.
- When the trend reverses, market will remove the stop and close the position.
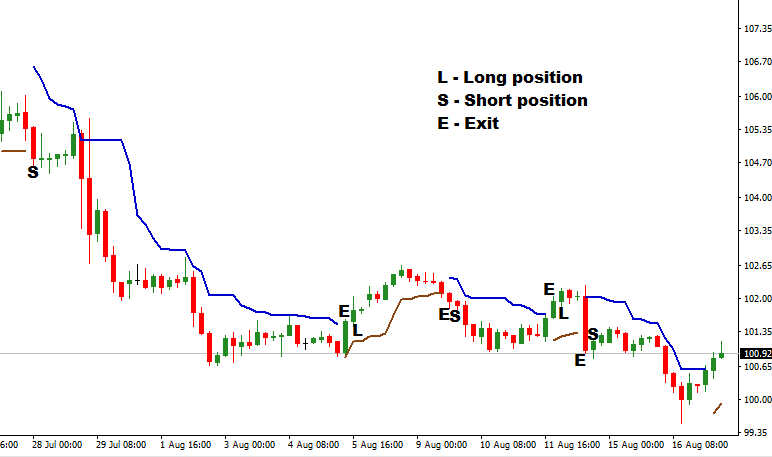
The USD/JPY example chart below illustrates the trading strategy on H4 timeframe:

Pros
- Enables a trader to squeeze out the last possible pip out of a trade with negligible risk.
- Allows creation of advanced strategies using multiple indicators.
Cons
- Good knowledge and practical experience are required to alter the Chandelier Exit multiplier value.
Chandelier Exit, to a certain extent, can be considered as an extension of the ATR indicator. With good practice, a trader will be able to filter out erroneous signals and trade the currencies with confidence.
I wanted to thank you for this great read!! I definitely enjoying every little bit of it I have you bookmarked to check out new stuff you post. FXGM ZA
ReplyDelete